How to Transition from Excel to SQL Database Using Power Query and Power BI

Whether you work for a corporate company or smaller in data-related jobs, you are familiar with that big part of analytics, business decisions etc. is coming from where? From EXCEL. We know that this is a powerful tool even in non-technical hands but it has its limits which we will cover in this post with the idea of how to get rid of it if possible with the help of SQL, Databases Power Query and PowerBI.
Why Move from Excel to SQL?
First, we will uncover what is the biggest Excel problem — SCALIBILITY. If you have
Excel is awesome when working with small datasets or needing something quick and dirty for analysis. But when your data grows or you need to collaborate with others, Excel can feel a bit… limiting. Here’s why SQL can be a better option:
- Scalability: SQL handles large datasets effortlessly.
- Collaboration: Databases allow multiple users to access and work on the same data without worrying about different versions.
- Automation: You can automate data import and reporting processes, making everything more efficient.
- Data Integrity: SQL gives you more control over your data structure, which helps minimize errors.
What You’ll Need
Before we dive into the how-to, make sure you have a few things ready:
1 Power BI Desktop: You can download this for free from Microsoft’s website.
2 SQL Server: On your local machine or a cloud service like Azure SQL Database.
3 Your Excel File: This is the data we’ll be moving to SQL.
Step 1: Clean and Prep Your Excel Data
First, make sure your Excel data is in good shape. This means:
- Data should be in a clean table format with clear column headers.
- No blank rows or columns, and avoid any merged cells.
- Ensure your data types (text, dates, numbers, etc.) are consistent in each column.
⠀After tidying up your Excel file, save it. It’s now ready to be imported.
Step 2: Use Power Query to Connect to Your Excel Data
Power Query is a powerful tool inside Power BI that lets you connect, clean, and transform data from various sources, including Excel.
Here’s how you can connect Power Query to your Excel file:
1 Open Power BI Desktop.
2 Click Home > Get Data > Excel.
3 Select your Excel file.
4 Choose the worksheet or table that you want to load into Power Query.
⠀Once you’ve selected the data, Power Query will display it for you to transform or clean further if needed.
For example, here’s a bit of M Code that shows how Power Query might structure your data:
let
Source = Excel.Workbook(File.Contents(“C:\YourFilePath\YourExcelFile.xlsx”), null, true),
Data = Source{[Name=”Sheet1"]}[Content],
ChangedType” = Table.TransformColumnTypes(Data,{{“ID”, Int64.Type}, {“Name”, Text.Type}, {“Date”, DateTime.Type}})
in
“Changed Type”
This code imports the data from your Excel sheet and ensures that columns like “ID” are stored as integers and “Date” as date types.
Step 3: Clean & Transform Your Data
Before moving the data to SQL, you should clean or transform it further in Power Query. Here are some common things you might do:
- Remove empty rows or columns.
- Change data types (for example, converting text fields to numbers).
- Split columns or merge them if necessary.
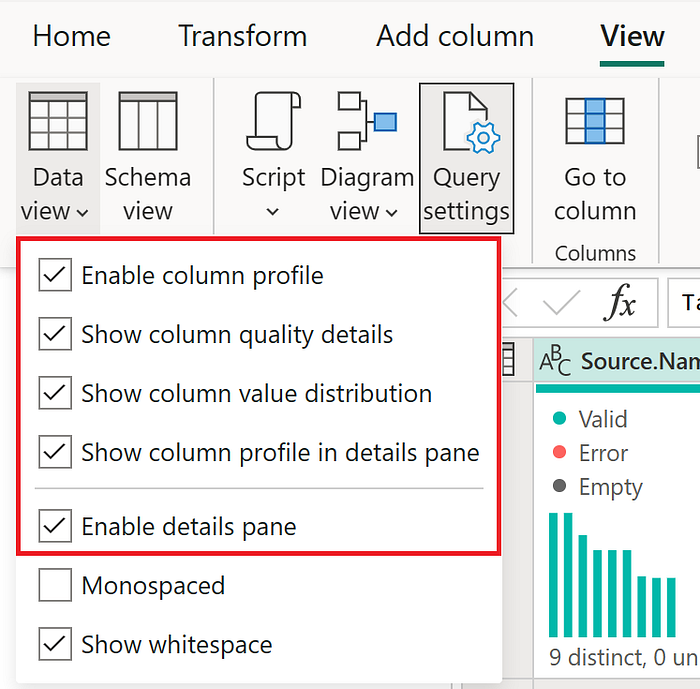
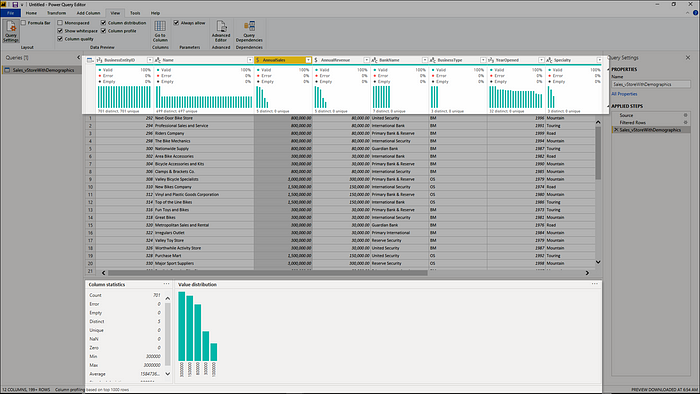
A quick tip: In power query, you can enable data profiling tools to get more visual info about your data and you can check which data is not correct.
Once you’ve made any needed changes, click Close & Load to load the data into Power BI.
Step 4: Export Data to SQL
Now that the data is in Power BI, it’s time to send it to your SQL database. Here’s how:
1 Go to Home > Transform Data > Transform Data.
2 In the Power Query Editor, check the M code for any final tweaks.
3 Go to Home > Get Data > SQL Server Database.
4 Enter your SQL server name and database name.
⠀For example, it might look like this:
Server = “YourServerName”
Database = “YourDatabaseName”
Once connected, you can either create a new table in SQL or replace an existing one. Just make sure the SQL table’s structure matches your data!
Step 5: Automate Data Refresh
One of the best parts about moving to SQL is that you can set up automatic data refreshes. This means that whenever your Excel file is updated, your SQL database will stay in sync. You can do this through Power BI Service or SQL Server Integration Services (SSIS).
In Power BI, it’s pretty simple:
1 Publish your report to Power BI Service.
2 Set up a data gateway.
3 Enable scheduled refreshes to ensure your SQL database stays up-to-date.
Step 6: Visualize Your SQL Data in Power BI
Now that your data is in SQL, you can use Power BI to create dynamic, real-time dashboards that connect directly to your database.
Here’s how you do it:
1 Go to Home > Get Data > SQL Server.
2 Enter your server and database details.
3 Choose DirectQuery for real-time data access.
⠀You can even write custom SQL queries to filter or aggregate the data before it gets visualized in Power BI. For instance:
SELECT *
FROM dbo.YourTable
WHERE Date BETWEEN ‘2023–01–01’ AND ‘2023–12–31’
Now you can create all kinds of interactive reports and dashboards using the full power of Power BI’s visualization tools!
Alternative solutions
I have an alternative for this solution, and it’s going to create a Power Apps solution to insert data into the database, if this is some type of reporting/control, you can easily transform it to Power App which will take this data and send it to SQL Server via integration (but it’s only available for premium plan). You can just insert it into the Power Apps database which stores input from users.
Wrapping It Up
Transitioning from Excel to an SQL database can seem like a big step, but with Power Query and Power BI, the process is straightforward and highly effective and I can say it from my experience as working as a Data Analyst. Not only will your data be more scalable and reliable, but you’ll also gain access to real-time analytics and automation.
By following these steps, you can ensure your data is clean, properly structured, and easily accessible for reporting and analysis — whether in Power BI or any other tool that supports SQL.
Key Points to Remember
1 Make sure your Excel data is well-prepared and cleaned before starting.
2 Use Power Query to easily connect, clean, and transform your data.
3 Export the data to SQL for better scalability and collaboration.
4 Automate your data refreshes for real-time insights.
5 Visualize your SQL data using Power BI to create dynamic reports and dashboards.
6 Think about better alternative solutions to create more automated processes.
Stay Connected
Follow me for the latest updates and exclusive content:
Share Your Thoughts
Leave a comment or reach out directly. Your insights help me create better content. Contact Me: My Linkedin profile
